TEST 2: Checking effectiveness of the GAP criterion

created by Ivan Koulakov (IPGG, SB RAS, Novosibirsk, Russia)

(more details on this test can be found on site "GAP nonsense in LET")

e-mail: KoulakovIY@ipgg.nsc.ru


TEST 2 is designed to model the case when all the sources are located outside the network. According to an existing stereotype, all the events with GAP>180 should be not considered in local-earthquake tomography, thus, in theory, no reasonable results can be achieved using this dataset. At the same time, everybody can check that this is not true. 

Basic parameters of the model:
  • Number of stations: 50;
  • Number of events: 200;
  • Number of rays: 12191 (P phases: 7648, S phases: 4543)
  • Noise: 0.1 s for P data and 0.15 for S data

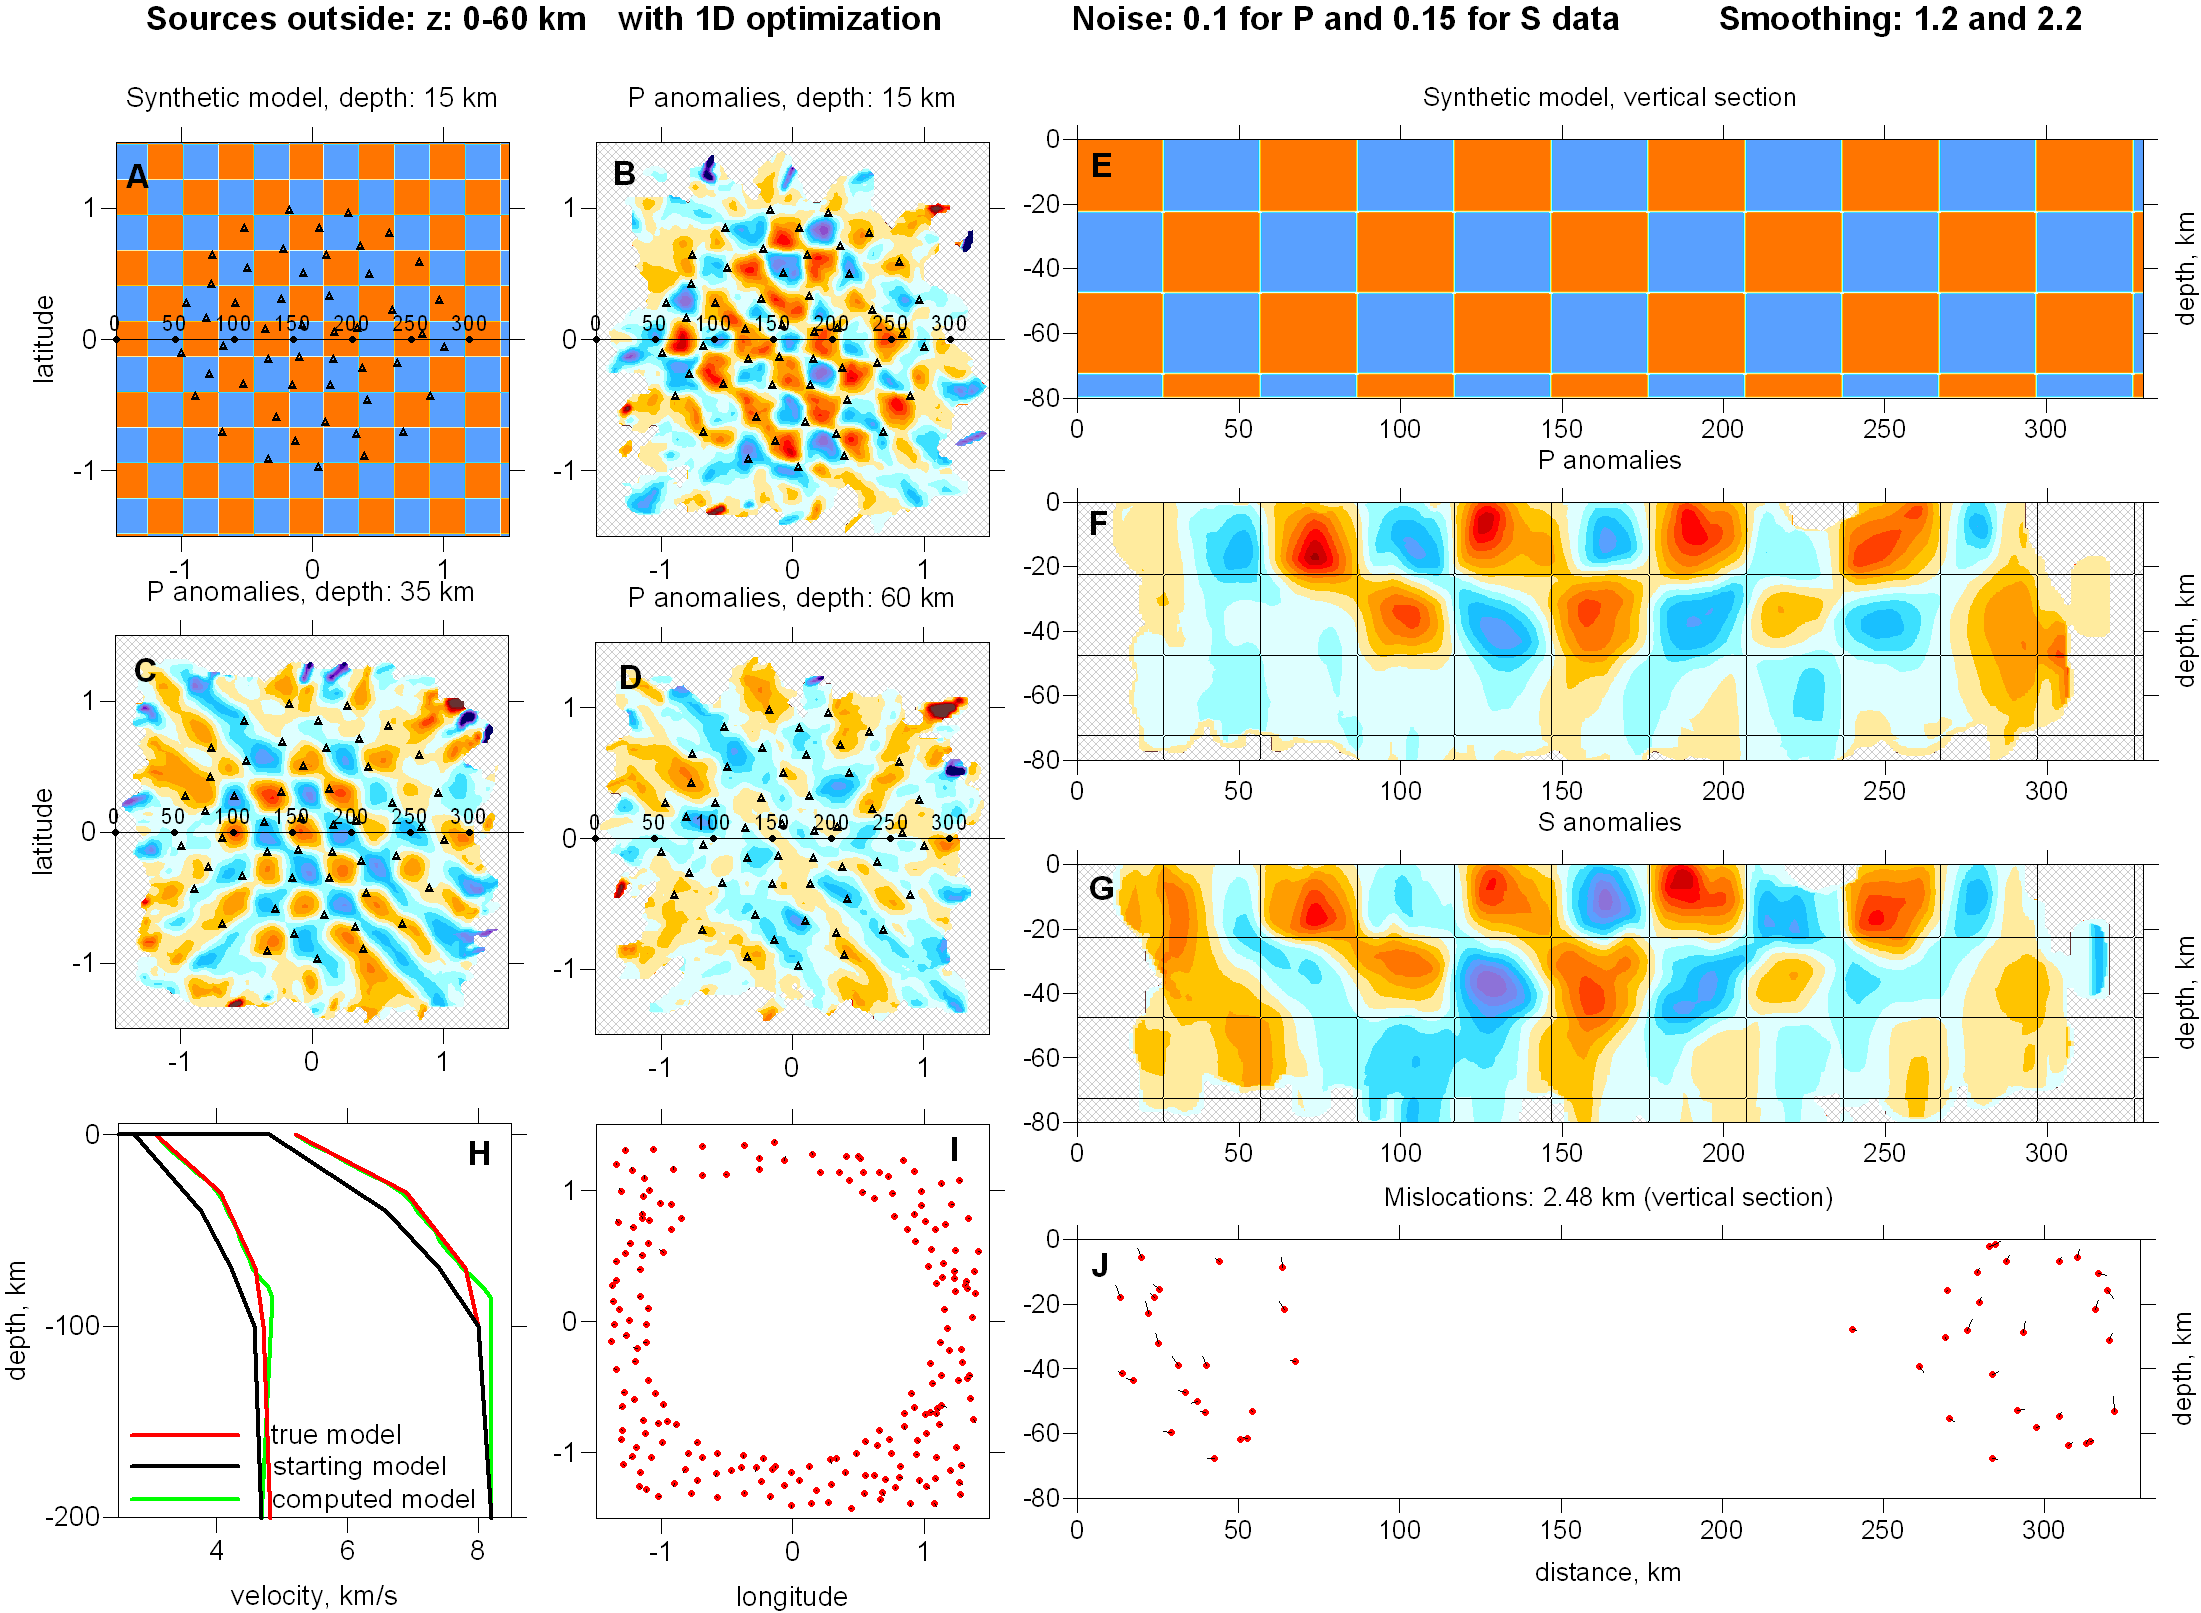
    Configuration of the model, data setup and inversion results obtained using LOTOS-07 code are shown in FIGURE 1:

    Figure 1. Inversion results using the sources located outside the network. A and E: synthetic model in a horizontal section ( 15 km depth) and vertical section (position of the section is indicated in A). Triangles show locations of stations. B,C and D: resulting P velocity anomalies in horizontal sections. F and G resulting velocity anomalies of P and S velocities in a vertical section shown in plots A-D. H: result of the 1D model optimization. Red line is the true model; black line is the starting model; green line is the retrieved model. I and J: locations of events in map view and in the vertical section. Red dots are relocated sources; bars show errors with respect to true coordinates.

    The data for this test can be downloaded using this link: "download inidata.zip"

    The data setup for this test has been produced artificially. The area of the station distribution is roughly isometric and is of ~200 km size. For each of 200 events the number of recorded P picks varies randomly from 25 to 50. For 40%-80% of the recorded P picks we create the S picks. In total, we have produced 12191 pairs of source/receivers corresponding to 7648 P and 4543 S phases. The travel times for this test have been computed using 3D ray tracing (our own version of bending method) through 3D checkerboard model with anomaly of +_ 2%. Then the coordinates and origin times of the sources, as well as "true" 1D model have been "forgotten". Here we present the dataset with approximate locations of sources estimated using an approximate 1D model (the same starting information is used by most of tomographic algorithms). The location of sources and optimization for the 1D model are calculated using the initial steps of LOTOS-07 code.

    The "inidata.zip" includes three files:

    1. "rays.dat" file which contains travel times and approximate source coordinates located in the 1D reference model "refmod.dat" (also approximate).

    First line is a description of an event which includes geographical coordinates: longitude (degree, W-negative), latitude (degrees, S-negative) and depth (km), and number of recorded phases, NPhase.

    After the line of source description, NPhase lines follow. First column is phase indicator (1:P, 2:S), second column is number of station according to the list in "stat_ft.dat". Third column is travel time, in second. Below is example for one events from "rays.dat":

      -1.317841      0.9982975       31.50000              45
               1          15   26.22949   
               2          15   45.25689   
               1          34   33.72011   
               2          34   57.17429   
               1           8   42.42081   
               2           8   72.18322   
               1          11   41.91318   
               2          11   71.86687   
               1           5   32.70572   
               2           5   55.70214   
               1           7   39.66212   
               2           7   67.92155   
               1          43   24.42760   
               2          43   41.77356   
               1          13   36.25513   
               2          13   61.80154   
               1          26   27.31455   
               2          26   46.53685   
               1           2   15.49090   
               2           2   26.16937   
               1          40   28.89000   
               2          40   48.61009   
               1          14   31.52957   
               2          14   53.23554   
               1          27   22.06399   
               2          27   37.52535   
               1           1   12.85219   
               2           1   21.77514   
               1           4   27.84778   
               2           4   46.88229   
               1          41   32.11546   
               2          41   54.52583   
               1          18   20.62126   
               2          18   35.08043   
               1          29   17.24921   
               2          29   29.76820   
               1          38   26.70750   
               1          20   31.60567   
               1          10   43.83544   
               1          30   22.84743   
               1          47   36.07906   
               1          37   23.47372   
               1          35   30.68942   
               1          23   38.05227   
               1          16   20.75333   

    2. "stat_ft.dat" is a file with station geographical coordinates which includes longitude, latitude and elevation which is given in km. Positive value means that the station is below sea level. In the presented synthetic dataset, all the stations are at 1 km depth below sea level. 

     -0.7642902      0.6408060       1.000000   
     -0.5177832      0.8476954       1.000000   
     -0.1744345      0.9797521       1.000000   
      0.2701586      0.9577430       1.000000   
      0.5826951      0.8080777       1.000000   
      0.8159962      0.5835809       1.000000   
      0.9656604      0.2930546       1.000000   
       1.005278     -5.9098393E-02   1.000000   
      0.8952304     -0.4332605       1.000000   
      0.6927426     -0.7061793       1.000000   
      0.3934121     -0.8954611       1.000000   

    3. "refmod.dat" is a file with description of an approximate reference model obtained after optimization using the LOTOS-07 code. If a number in the first line is not equal to zero, it represents the Vp/Vs ratio, and Vs is computed by dividing Vp to this value. Otherwise, the model is defined in three columns: depth (km) - Vp (km/s) - Vs (km/s). Below is an example:

      0.0000000E+00
      0.0000000E+00   5.198770       3.078585   
       5.000000       5.450430       3.194918   
       10.00000       5.754594       3.349319   
       15.00000       6.018513       3.530035   
       20.00000       6.299120       3.701367   
       25.00000       6.599904       3.886816   
       30.00000       6.828909       4.008580   
       35.00000       6.978944       4.095637   
       40.00000       7.072870       4.160419   
       45.00000       7.189481       4.234506   
       50.00000       7.349337       4.307664   
       55.00000       7.397573       4.357104   
       60.00000       7.516285       4.428840   
       65.00000       7.656312       4.496639   
       70.00000       7.761329       4.547115   
       75.00000       7.936140       4.659868   
       80.00000       8.082479       4.786387   
       85.00000       8.187494       4.848321   
       200.0000       8.200000       4.685714   
       400.0000       8.400000       4.800000