A tomographic algorithm, LOTOS-09 (Local Tomography
Software) is designed for simultaneous inversion for P and S velocity structures
(or Vp and Vp/Vs ratio) and source coordinates. The LOTOS-09 algorithm can
be directly applied to very different data sets without complicated tuning of
parameters. It has a quite wide range of possibilities for performing different
test and is quite easy to operate. LOTOS-09 code can be freely downloaded
from this site
Files to download:
1. Manual with detailed description of the LOTOS-09 code, version of February 2009 (64 pages): Microsoft Word document lotos-09_02_2009.doc (2 167 Kb) ]
2. Descriptions of several testing models with pictures which can be used as template for constructing new models: Microsoft Word document test_examples.doc (2 944 Kb)
3. ZIPPED file with the executable version of the LOTOS-09 code, lotos_9_exe.zip (11 281 Kb)
4. Examples of different datasets, data_for_lotos_9.zip (2 306 Kb)
5. Examples of PNG bitmap pictures with the results for the testing datasets, pics.zip (6 246 Kb)
6. In some configurations of the Windows operation system, few executable files used for visualization which are written in C-sharp language might be not working. To check prompt working the visualization tool, please download a testing example preview_test.zip (128 Kb) to any location of your computer and unpack it. When you click on "visual.exe", it will produce a picture "picture.png" in the same directory. To check if visualization is correct, the "picture.png" can be compared with "test_picture.png" in the same folder. If everything is correct, these pictures should be identical.
7. In case if "visual.exe" does not work, it probably means that some necessary libraries are not installed, and a free software DotNet Framework should be downloaded and installed dotnetfx.exe (23 510 Kb) . If it does not help anymore, please address to Ivan Koulakov ( ivan.science@gmail.com).
When using the code or any part of it please refer to the following paper:
Koulakov I., 2009, LOTOS code for local earthquake tomographic inversion. Benchmarks for testing tomographic algorithms, Bulletin of the Seismological Society of America, Vol. 99, No. 1, pp. 194-214, doi: 10.1785/0120080013
The main changes with respect to the previous version, LOTOS-07
EXE version of the LOTOS-09 code. Instructions
for installing and running
The EXE version of the code is created to perform the the full tomographic
inversion in a most simple way.
In order to perform and execute the tomographic inversion using the EXE version
of the code, the following steps should be performed:
1. Download a Packed file with the entire code: lotos_9_exe.zip
(11 281 Kb)
2. Copy this file to any location of your computer and unpack.
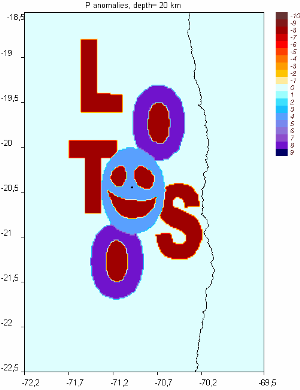
3. In the present form, the code is ready for performing the inversion of the
synthetic dataset "DATASET2" and model "model_01". This
example is purely synthetic. Synthetic model and reconstruction result are presented
in pictures below. In this dataset we use only 12 stations, 202 events, 1952
P picks and 1237 S picks. This dataset is rather light: full inversion procedure,
which includes preliminary source locations, 1D model optimization, and iterative
tomographic inversion (5 iterations), takes about 40 minutes at my 4 year old
laptop.
The initial data for this test are located in "\DATA\DATASET2\inidata\"
and contain two files "stat_ft.dat" and "rays.dat".
4. The reconstructed model will be produced in a folder
"\DATA\DATASET2\model_01\". All the parameters for inversion, grid construction,
source location, visualization and other are located in a folder
"\DATA\DATASET2\model_01\ini_param".
5. Start execution of the program by clicking on START_REAL_VP_VS.BAT
in the root directory.
6. After each iteration, a series of PNG files with the inversion results in
horizontal and vertical sections are automatically generated in folder "PICS\DATASET2\model_01\hor\"
and "PICS\DATASET2\model_01\vert\". These pictures
can be compared with those in the document "Test_examples.doc" (2 406 Kb). If the pictures
are the same, it means that the program works correctly.
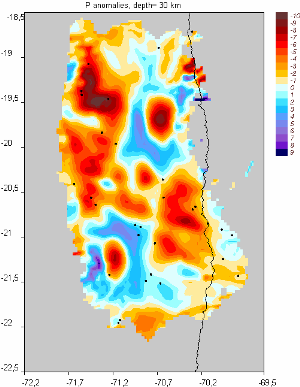
7. Alternatively the results can be viewed by SURFER. The code produces grid files with P and S velocity anomalies in different depth sections horizontal section which are located at "EXE_version\FIG_files\hor\", which have the input formal for contour lines in SURFER. Example of a SURFER file can be downloaded here: "result_hor_30km_3it.zip" (804 Kb) . The results should be the same as in the picture below:
8. Similar GRD files are automatically generated for vertical sections after each iteration in directory: "EXE_version\FIG_files\ver\", which can be directly visualized in Surfer.
7. The EXE version of the code
can be used for processing of any other datasets. In particular, one can perform
the inversion for the other different testing datasets
which can be downloaded as data_for_lotos_9.zip (2 306 Kb) . These datasets have
ready structure to start execution of the calculations. They include the initial
datasets (stat_ft.dat and rays.dat) and initial parameters:
In order to start the inversion for any of these datasets,
one should unzip these files and copy them to "\DATA\"
folder. Then in the file "\all_models.dat" indicate
the name of the dataset and the model. For example, for "TURKEY__" dataset and
"MODEL_01", this file would be as follow:
1 - 2: code of the region (any
8 characters) and model (8 char)
3: number of iterations
4: 0 all data, 1 odd events, 2 even events
5: kode for ref. mod. optimization. 1-yes
**********************************************
TURKEY__ MODEL_01 5 0 1
Then execution of the program can be started by clicking on START_REAL_VP_VS.BAT.
The same algorithm can be used for any real or synthetic dataset.
The detailed instructions on using the code for real and synthetic
modeling are given in the manual: lotos-09_02_2009.doc
(2 102Kb)
In case of any unconsistencies, errors, unclear issues and other problems, please
do not hesitate to contact the author,
Ivan Koulakov, e-mail:
ivan.science@gmail.com